October 5th, 2003
I started stock investment seriously in 2001. I resisted buying anything in 1999 and 2000 because I just couldn’t find any stocks to buy using my investment strategy.
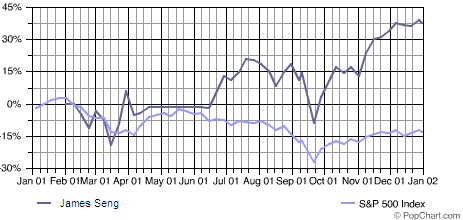
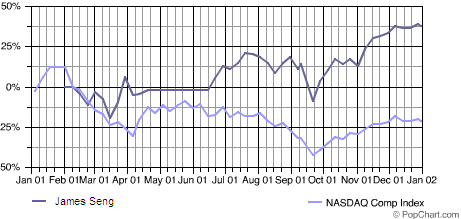
The .com bubble burst in 2001 opens some opportunities to invest. I remember I couldn’t sleep for a few days the first time I bought some shares. It was quite a substainable portion of my net worth then and the market is swingly crazyly. Nevertheless, it works out okay and I achieve a net gain of 37.97% compared to S&P (-13.04%) and NASDAQ (-21.05%).
|
YTD
|
JAN
|
FEB
|
MAR
|
APR
|
MAY
|
JUN
|
JUL
|
AUG
|
SEP
|
OCT
|
NOV
|
DEC
|
James Seng
|
37.97%
|
0.00%
|
-3.24%
|
9.67%
|
-7.24%
|
0.00%
|
14.96%
|
4.60%
|
0.20%
|
-12.76%
|
8.92%
|
18.71%
|
3.13%
|
Q1 Performance
6.12%
|
Q2 Performance
6.64%
|
Q3 Performance
-8.56%
|
Q4 Performance
33.35%
|
S&P 500
|
-13.04%
|
3.46%
|
-9.23%
|
-6.42%
|
7.68%
|
0.51%
|
-2.50%
|
-1.07%
|
-6.41%
|
-8.17%
|
1.81%
|
7.52%
|
0.76%
|
Q1 Performance
-12.12%
|
Q2 Performance
5.52%
|
Q3 Performance
-14.98%
|
Q4 Performance
10.30%
|
NASDAQ
|
-21.05%
|
12.23%
|
-22.39%
|
-14.48%
|
15.00%
|
-0.27%
|
2.37%
|
-6.17%
|
-10.94%
|
-16.98%
|
12.77%
|
14.22%
|
1.03%
|
Q1 Performance
-25.51%
|
Q2 Performance
17.41%
|
Q3 Performance
-30.62%
|
Q4 Performance
30.13%
|
|
|
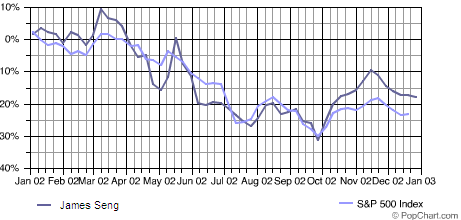
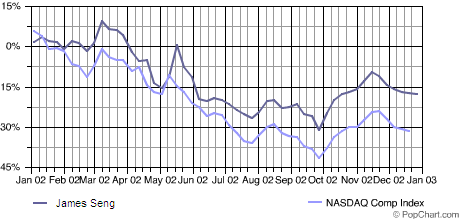
2002 is a bad year. After 9/11, the market recovery slightly only to encounter Worldcom and Enron. The market sentiment horrible. It was the time when those who makes money are the ones who do short-selling. I was tracking RSAS then and was buying them as the prices falls. Needless to say, I lost a chuck of my portfolio on RSAS. I turn out to be right later and I close the year with a net lose of -17.93% compared to S&P (-23.37%) and NASDAQ (-31.53%).
|
YTD
|
JAN
|
FEB
|
MAR
|
APR
|
MAY
|
JUN
|
JUL
|
AUG
|
SEP
|
OCT
|
NOV
|
DEC
|
James Seng
|
-17.93%
|
-1.24%
|
-1.91%
|
7.52%
|
-16.66%
|
2.09%
|
-9.17%
|
-4.78%
|
0.23%
|
-6.45%
|
14.01%
|
8.54%
|
-7.72%
|
Q1 Performance
4.16%
|
Q2 Performance
-22.72%
|
Q3 Performance
-10.72%
|
Q4 Performance
14.19%
|
S&P 500
|
-23.37%
|
-1.56%
|
-2.08%
|
3.67%
|
-6.14%
|
-0.91%
|
-7.25%
|
-7.90%
|
0.49%
|
-11.00%
|
8.64%
|
5.71%
|
-6.03%
|
Q1 Performance
-0.07%
|
Q2 Performance
-13.74%
|
Q3 Performance
-17.63%
|
Q4 Performance
7.92%
|
NASDAQ
|
-31.53%
|
-0.84%
|
-10.47%
|
6.58%
|
-8.51%
|
-4.29%
|
-9.44%
|
-9.22%
|
-1.01%
|
-10.86%
|
13.45%
|
11.21%
|
-9.69%
|
Q1 Performance
-5.38%
|
Q2 Performance
-20.70%
|
Q3 Performance
-19.90%
|
Q4 Performance
13.94%
|
|
|
Charts and data from my E*Trade account.
This entry was posted on Sunday, October 5th, 2003 at 8:30 am and is filed under
Investments. You can follow any responses to this entry through the
RSS 2.0 feed.
Responses are currently closed, but you can
trackback from your own site.